This month we’ve rounded up statistics from the last two years, and taken a look at what Felt looks like in the COVID era, from traffic and sales, to demographics and devices. Based on what we’ve observed, we’ve also come up with some tips for you to try out in 2022!
Felt in a time of COVID
2020 was a strange year all round, for everybody – and Felt was no exception. In 2020 we experienced record highs in just about every metric, and in 2021 we weren’t too sure what to expect. As it turned out, traffic and sales remained largely steady.
While ongoing supply chain disruptions and delays internationally have given locally made products an edge over imported goods, we’ve also seen customers continue to think carefully about where they spend their money, and prioritise their support for local businesses. We hope this is a long term trend!
Sales and spending, 2019 (pre-pandemic) to now
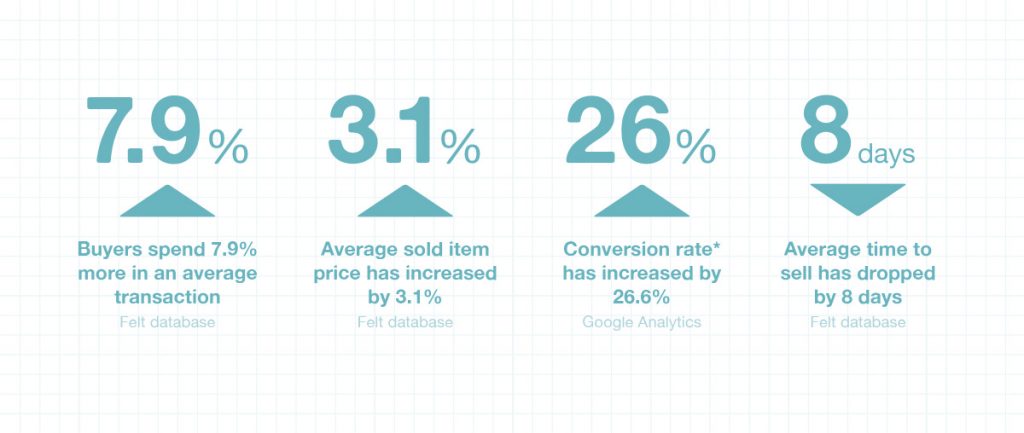
- Buyers spend 7.9% more in an average transaction Felt database
- Average sold item price has increased by 3.1% Felt database
- Conversion rate* has increased by 26.6% Google Analytics
- Average time to sell has dropped by 8 days Felt database
- In an average month, more than twice as many items are purchased Felt database
On the sales and spending front, the news is all good for Felt sellers. There are more visitors, they are more likely to make a purchase when visiting Felt, and they spend more when they do – 7.9% more in an average transaction!
The average time it takes an item to sell has dropped by eight whole days, and the average price of a sold item has increased by 3.1%.
TIP Be sure to review the prices of your items regularly. With record inflation increasing material and living costs, it’s important to ensure you’re covering your costs and overheads, and making a healthy profit too. Read more about pricing »
* Conversion rate is a measure of how many visits to Felt result in a purchase.
Sales (by revenue to Felt sellers) in 2021

2021 followed a fairly typical pattern of consistent sales through the year with periodic spikes, and a significant increase in sales in the lead up to Christmas. Many of the spikes are caused by our major promotional emails (marked as yellow points on the graph), which go out monthly and around key dates, such as Mother’s Day. In 2021 these emails generated nearly 10% of all sales on Felt.
TIP Buyers often return to Felt at various times throughout the year to track down something they’ve previously spotted for a birthday or other occasion. Keeping your shop active and stocked means they can find you easily when they need to.
That notable spike you can see in early September was caused by our monthly email coinciding with the announcement of mandatory face masks as most of the country returned to Alert Level 2. You can also see a jump to higher sales levels at the start of November with our first Christmas marketing email and the launch of the Christmas Gift Guide.
Christmas sales in 2021 started to build early, and dropped off rapidly a few days earlier than usual. We observed customers shopping earlier with awareness of potential delays, sellers building a bit of contingency into Christmas delivery deadlines, and sensible caution around last minute pick ups in person.
TIP Listing consistently throughout the year to maintain your presence on Felt not only means we can weave your beautiful products into our ongoing promotions, but you’re well placed for changing retail patterns and prepared in advance for the busy Christmas season, wherever the peak occurs.
An overview of Felt visitors in 2021
- 80.6% more visits in 2021 than in 2019 Google Analytics
- 86.8% of all visitors to Felt in 2021 were in New Zealand, and they accounted for 95.3% of sales Google Analytics
With more focus on supporting local business, and ever-growing awareness of Felt, there are more shoppers on Felt now than ever before. In the last two years we’ve seen fewer international visitors, but increases in every other metric – New Zealanders are backing local makers and shopping local online.
Distribution of visitors to Felt by age group and gender, 2021
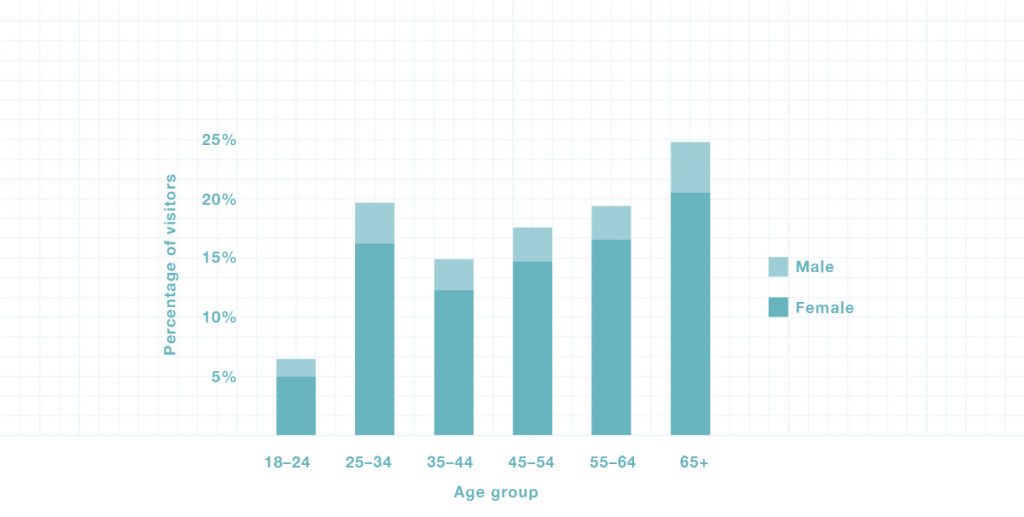
Felt has a fairly even spread of visitors over the age of 25, with a similar gender split across those age groups. We’re seeing an increasing number of visitors in the 65+ bracket, which has perhaps been bolstered by increased technology uptake and confidence due to periods of lockdown and isolation.
TIP Consider how different materials, colours, shapes, or styles might make your existing products more appealing to different customers. Brainstorm new product ideas that match your skill set but appeal to a different audience.
In 2021, 17.3% of our total visitors were male. Men spent, on average, 14.6% more than women, making them valuable customers. Keep recommending Felt to the men in your life as a great place to shop and find gifts – if we’re all introducing new people to Felt, everyone reaps the benefits.
TIP Where appropriate and relevant, craft your descriptions and keywords to reach those buying gifts for men, as well as male shoppers. The majority of our visitors are female, but they often have men to buy for. Read more about keywords »
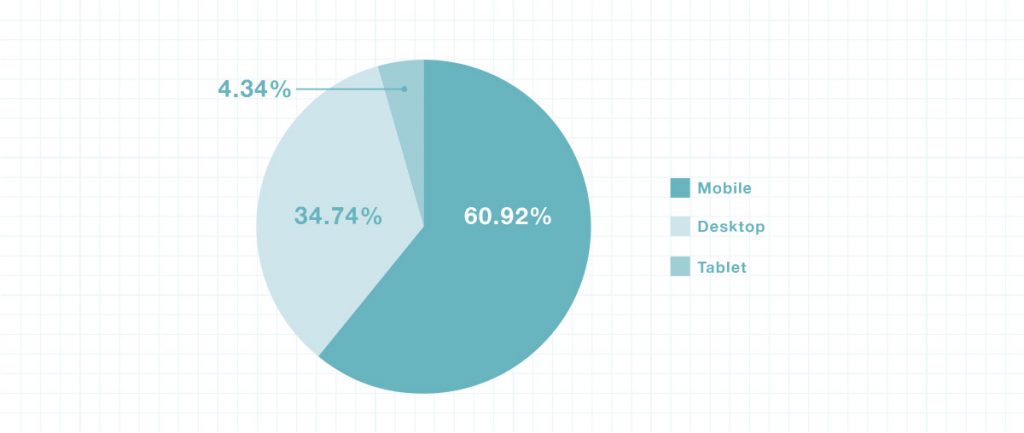
Platform used (% of sessions on a device), 2021
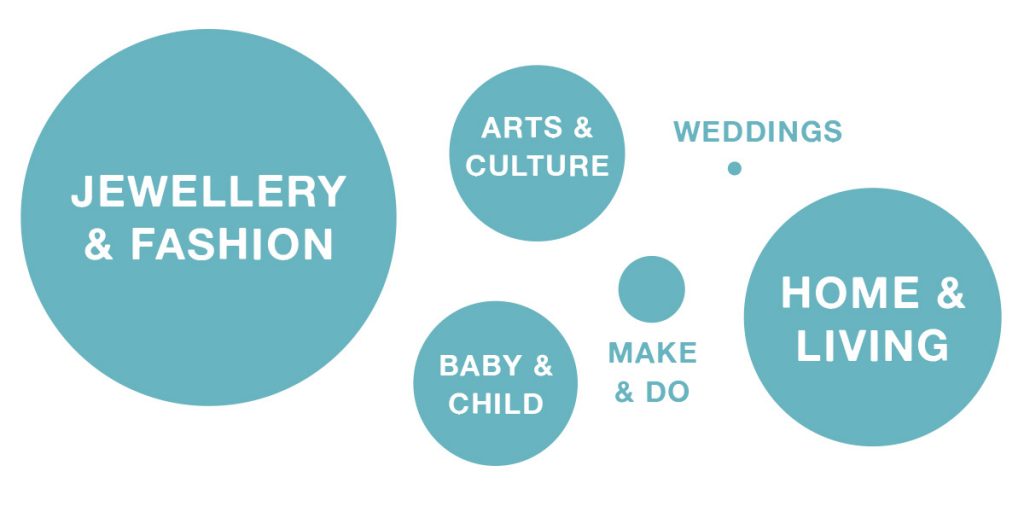
The Felt solar system: Relative category sizes
Jewellery & Fashion remains Felt’s largest top level category, followed by Home & Living, but for the first time in 2021, Arts & Culture takes third place, just ahead of Baby & Child. All of these categories are well-populated and this is reflected in sales, but there’s always space for original new products, quality craftsmanship, and unique spins on the traditional.
TIP When listing items, think carefully about where or how customers might be likely to look for an item like yours, and what search terms or categories they might logically use. If your items fit in more than one place, list them in multiple categories.
Ceramics has been a particular area of growth in the last 18 months, both in supply and demand, filling out several sub-categories in Home & Living and Arts & Culture.
With Baby & Child dropping in relative size, we see some opportunities for sellers to establish a niche and gain some visibility here – this is an area that does well over the Christmas period. In Make & Do we see space for more craft supplies (note that all the usual Felt direct-from-the-maker rules still apply here), fibre, yarn, and textiles (hand dyed, spun, or handwoven), and DIY kits of your design.
TIP If you’re looking for a new direction or a niche to fill in 2022, browse the categories and note the gaps! There is a delicate balance for Felt between growing demand (finding more buyers) and meeting demand (having more of your items for sale) in the categories. We’re always happy to chat and offer our insights if you have an idea to put out there.


It’s always fascinating to see the statistics. Thank you, Felt!
Our pleasure 🙂